A work-order console for technicians
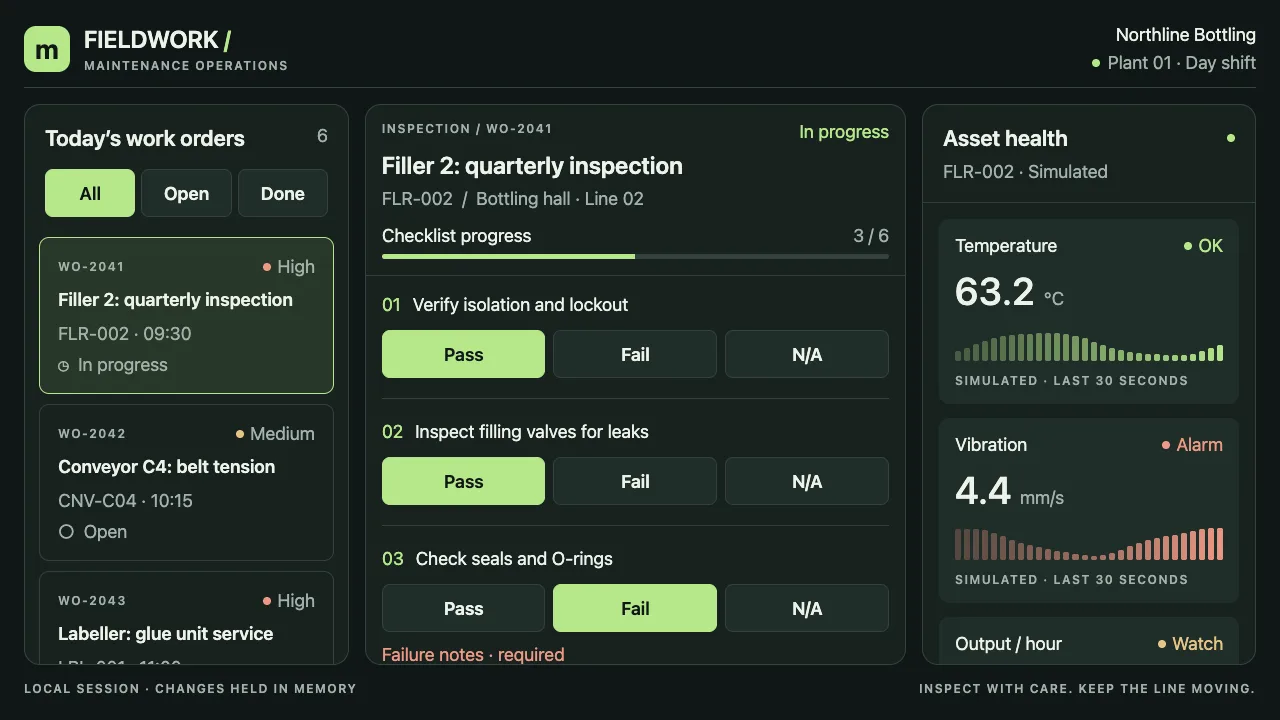
Pick a work order, answer its inspection checklist with Pass, Fail or N/A, watch the asset's readings, and sign off: a panel that floats beside the machine.
- Panel app
- Field service
- Checklist and sign-off
Open the appRuns in a browser, on a Quest or a Vision Pro.
The request, word for word
This is the text that was sent to the agent to start the project. Nothing was edited for this page.
Turn this into a work-order and inspection console, the kind of tool a maintenance company would commission for technicians who wear a headset: it floats as a panel next to the machine they are working on. Three columns on a wide panel, stacked into tabs on a narrow one. Left: today's work orders (make up six for a bottling plant: "Filler 2: quarterly inspection", "Conveyor C4: belt tension", "Labeller: glue unit service"...), each with its asset, priority (High, Medium, Low as a coloured dot), due time and state (Open, In progress, Done). The selected one is highlighted. A filter row at the top: All, Open, Done. Centre: the selected work order: title, asset, location, and its inspection checklist of 6 to 8 steps. Each step has three big buttons, Pass, Fail and N/A, and a notes field that opens when Fail is chosen and is required before sign-off. A progress bar on top shows how many steps are answered. At the bottom a large "Sign off" button, disabled until every step is answered; signing off marks the order Done, records the time, and shows a summary card (passes, fails, time taken, the notes of failed steps) with "Next work order". Right: three live tiles for the selected asset with simulated readings that change every second and are clearly labelled "Simulated": temperature, vibration and output per hour, each with the value large, a small sparkline of the last 30 readings drawn with plain Views, and a state (OK, Watch, Alarm) by threshold. Below them, a short alarm feed that adds a line whenever a tile goes to Alarm. Everything is pointed at from a distance with a hand or a controller: targets at least 44 points, clear hover and pressed states, no gesture that needs two fingers, readable type (18 points and up for content). Dark theme, calm colours, one accent. Keep it in TypeScript, state in memory with React hooks, no new native modules; split the screen into a few components under a components folder and keep the made-up data in one file.
How it went
- Runs
- One run: the request above, and it was done. A run ends only when the project builds and loads in a real browser without errors.
- Started from
- The Expo panel app template: A flat app that opens as a floating panel on Meta Quest, Meta VR Glasses and Android XR, and as a web page everywhere else: big targets, a layout that fits a window, built with Expo.
- Notes and credits
- The asset readings are simulated and say so on the screen. AI: Codex CLI.
Build your own
Graspable is a desktop app. Describe the scene you want, and the agent builds it as a real project on your computer and checks that it runs. It is free with your own AI account.
More examples
 React XR template
A tape measure in a real room
Point at any surface, pull the trigger, and read the distance on a steel tape.
- Real-room scan
- Controllers
- PBR materials
Read the request that made it (3 runs)
 XR Game template
Arcade basketball
Grab a ball off the rack, swing, let go: it bounces off the backboard, rattles the rim and the scoreboard counts.
- Controllers
- Physics
- Game
- Sound
Read the request that made it (one run)